|
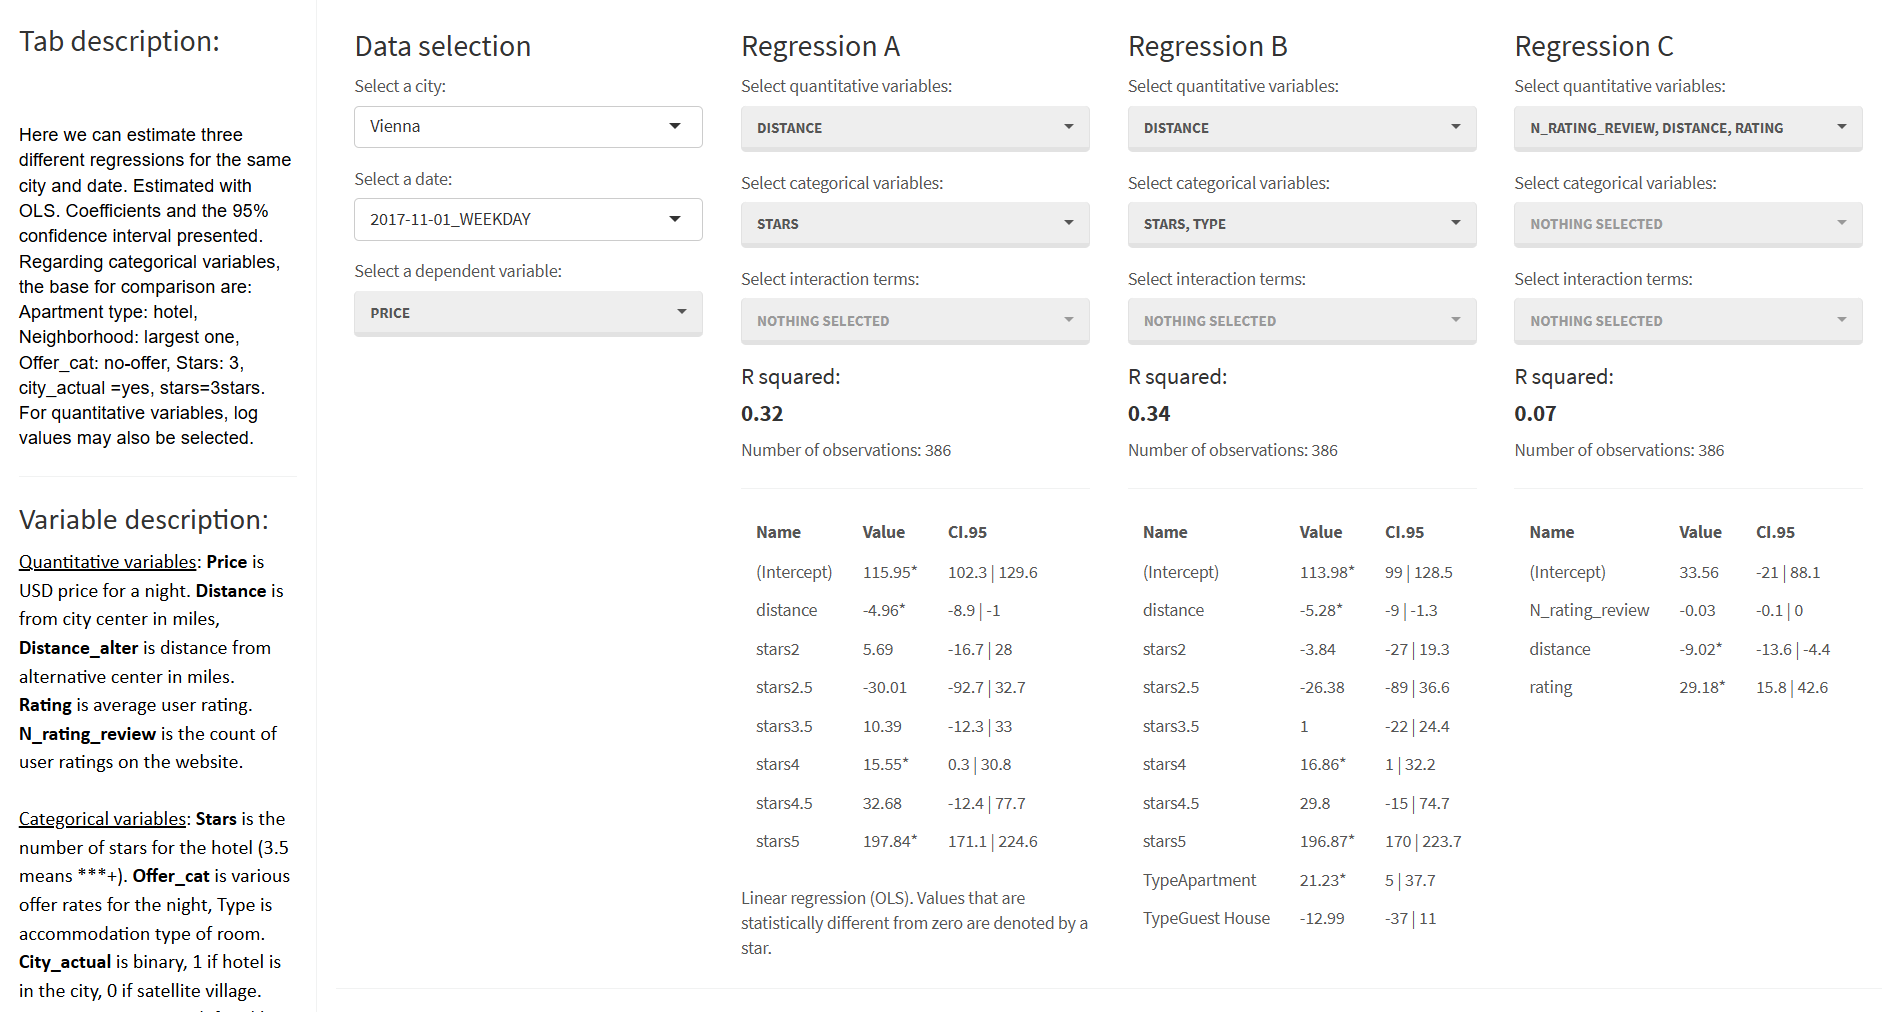
Data Exploration to Regression - A Full Case Study Data Exploration to Regression - A Full Case Study Interact with the hotels-europe dataset to practice exploratory data analysis (EDA), build simple and multiple linear regression models, and learn how to handle messy data. A complete, hands-on case study. Related textbook chapters: 03, 04, 07, 08, 09, 10. |
|
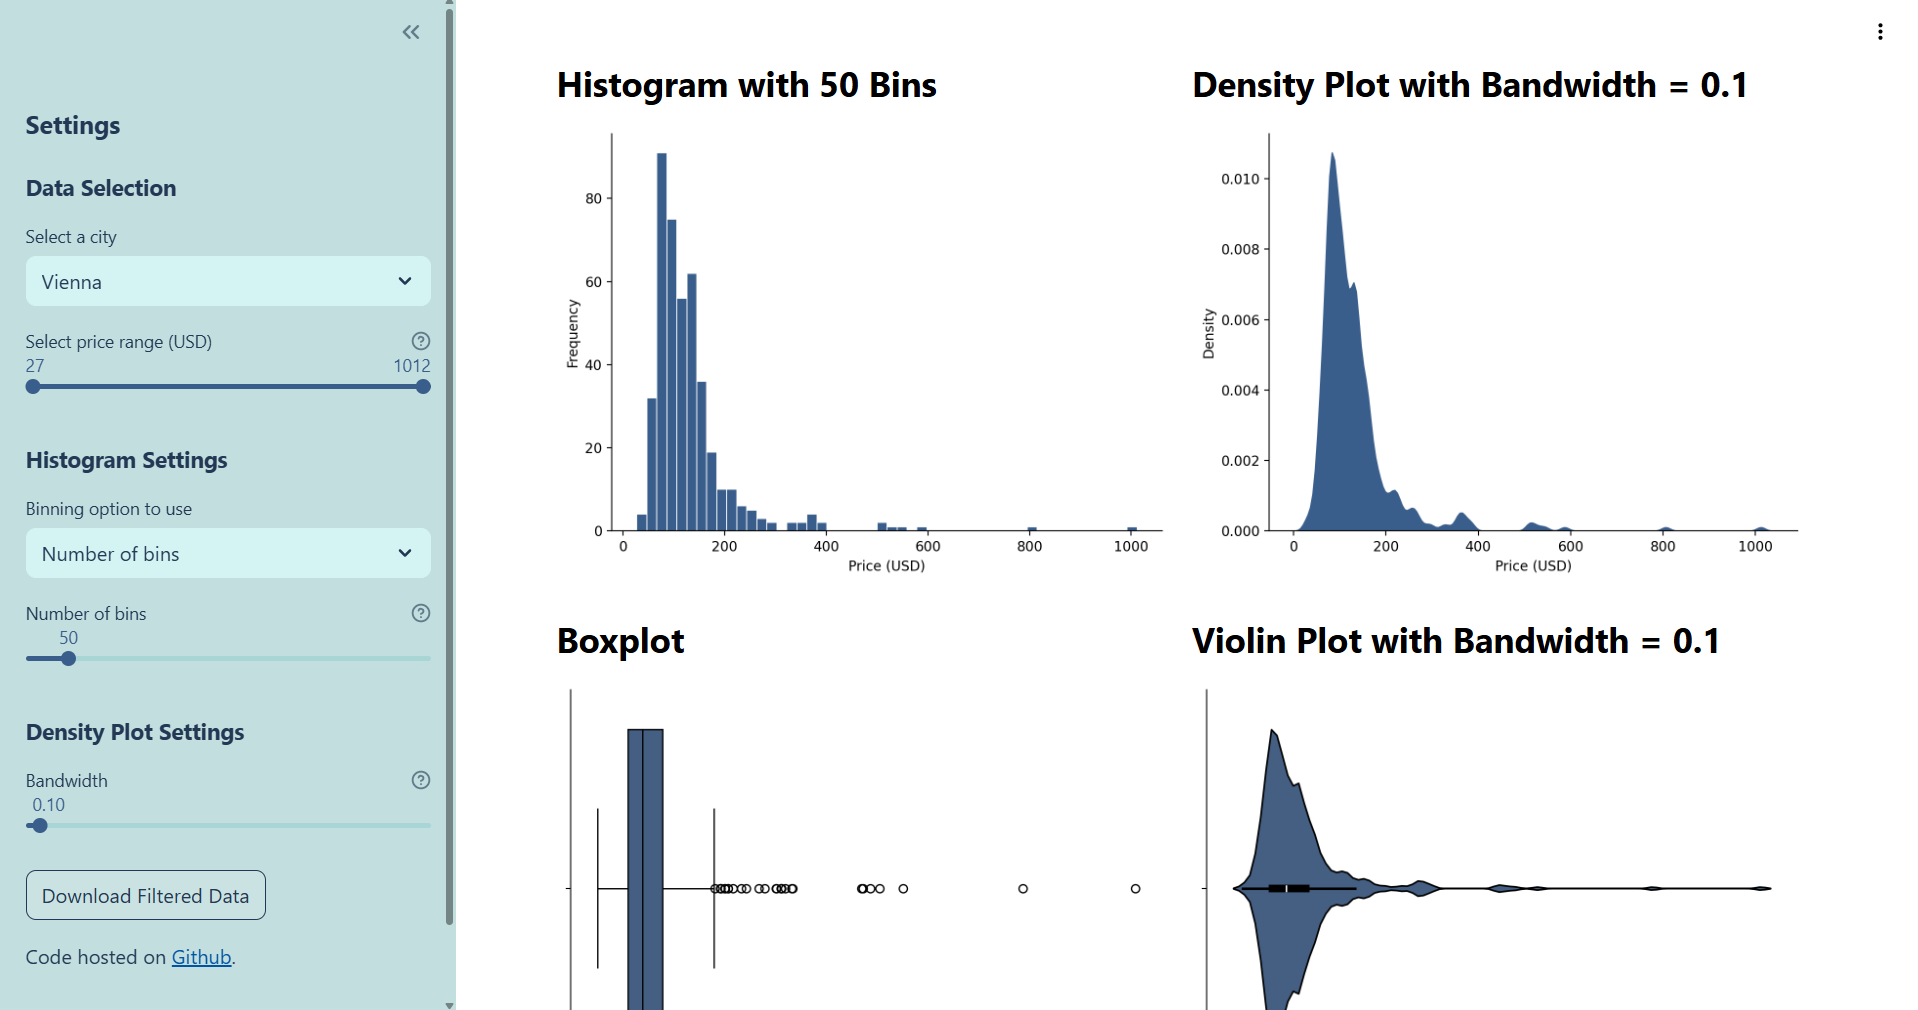
Chart Your Data - Visualizing Distributions Chart Your Data - Visualizing Distributions Explore different types of interactive charts (histograms, density plots, violin plots, boxplots) to effectively visualize and understand data distributions. See how visualization choices impact your interpretation of the data. Related textbook chapter: 03. |
|
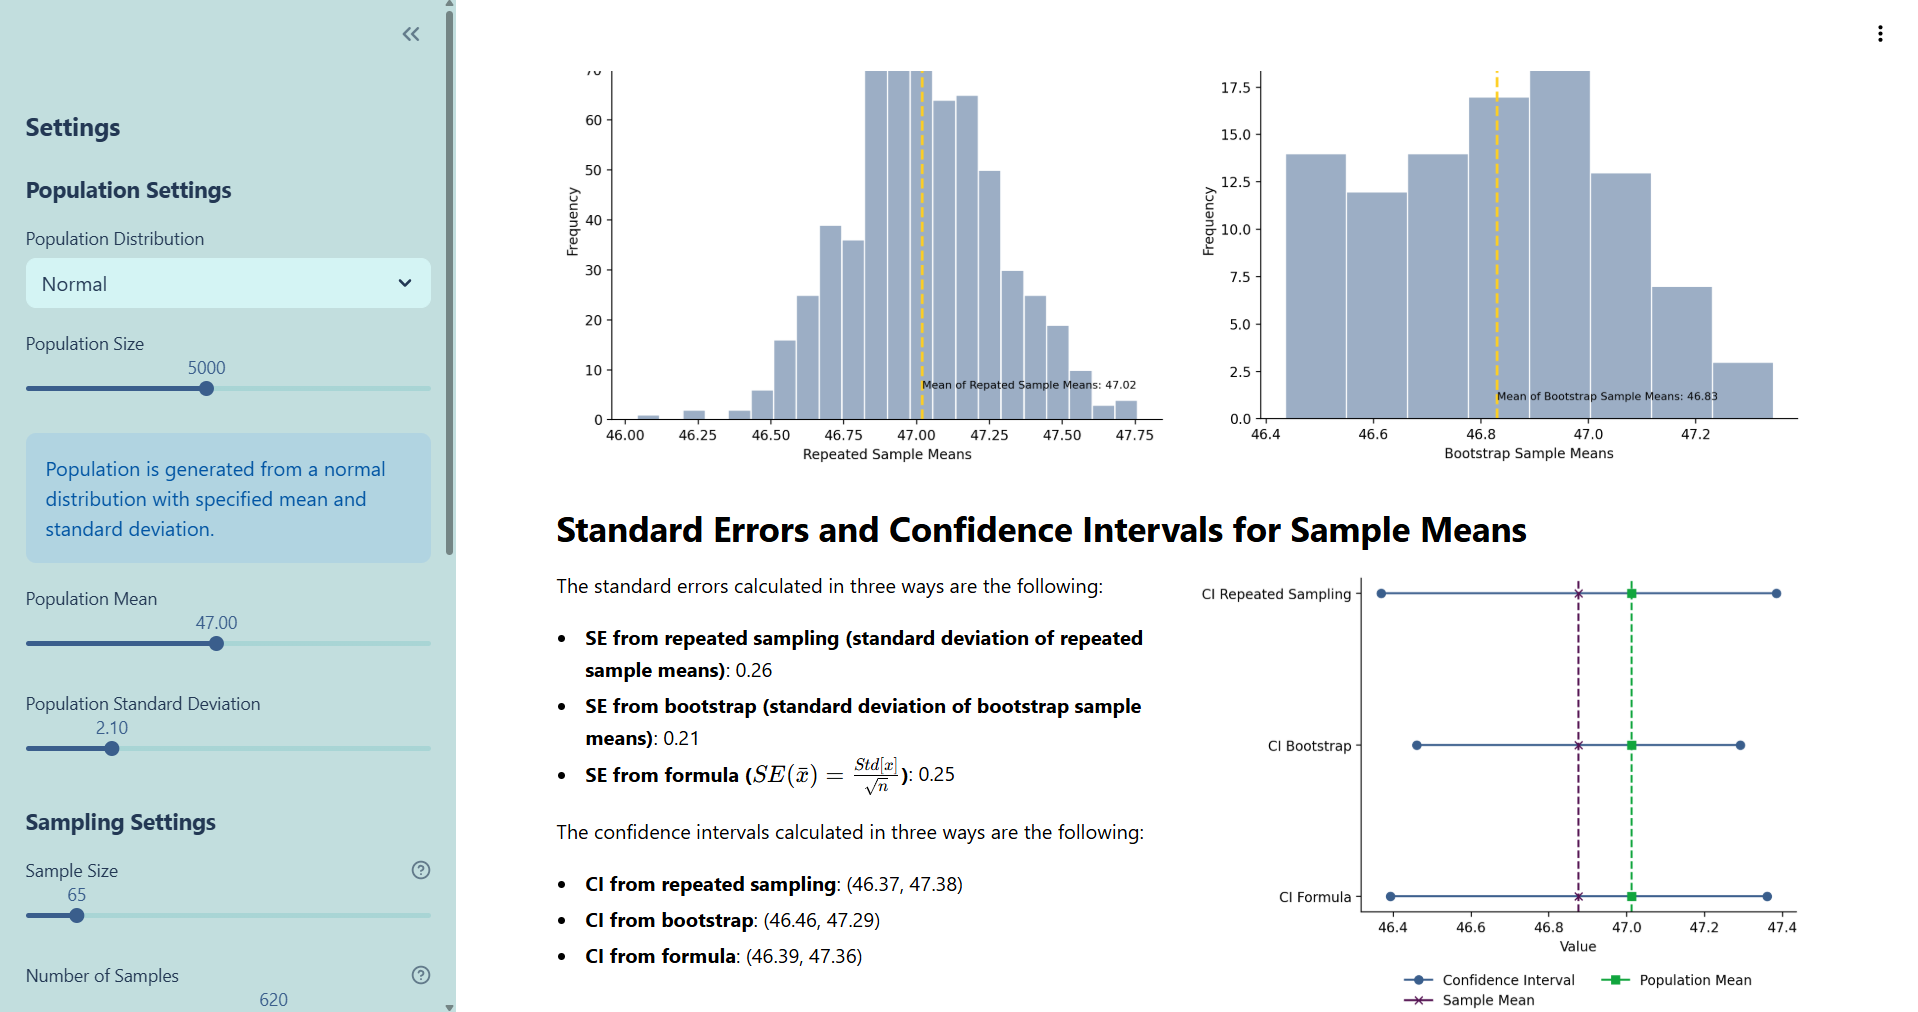
Generalizing from Sample to Population - Standard Errors Generalizing from Sample to Population - Standard Errors Dive into the core concept of statistical inference. Use interactive tools to calculate various standard errors and explore how different methods allow you to confidently generalize findings from a sample set to the broader population or general pattern. Related textbook chapter: 05. |
|
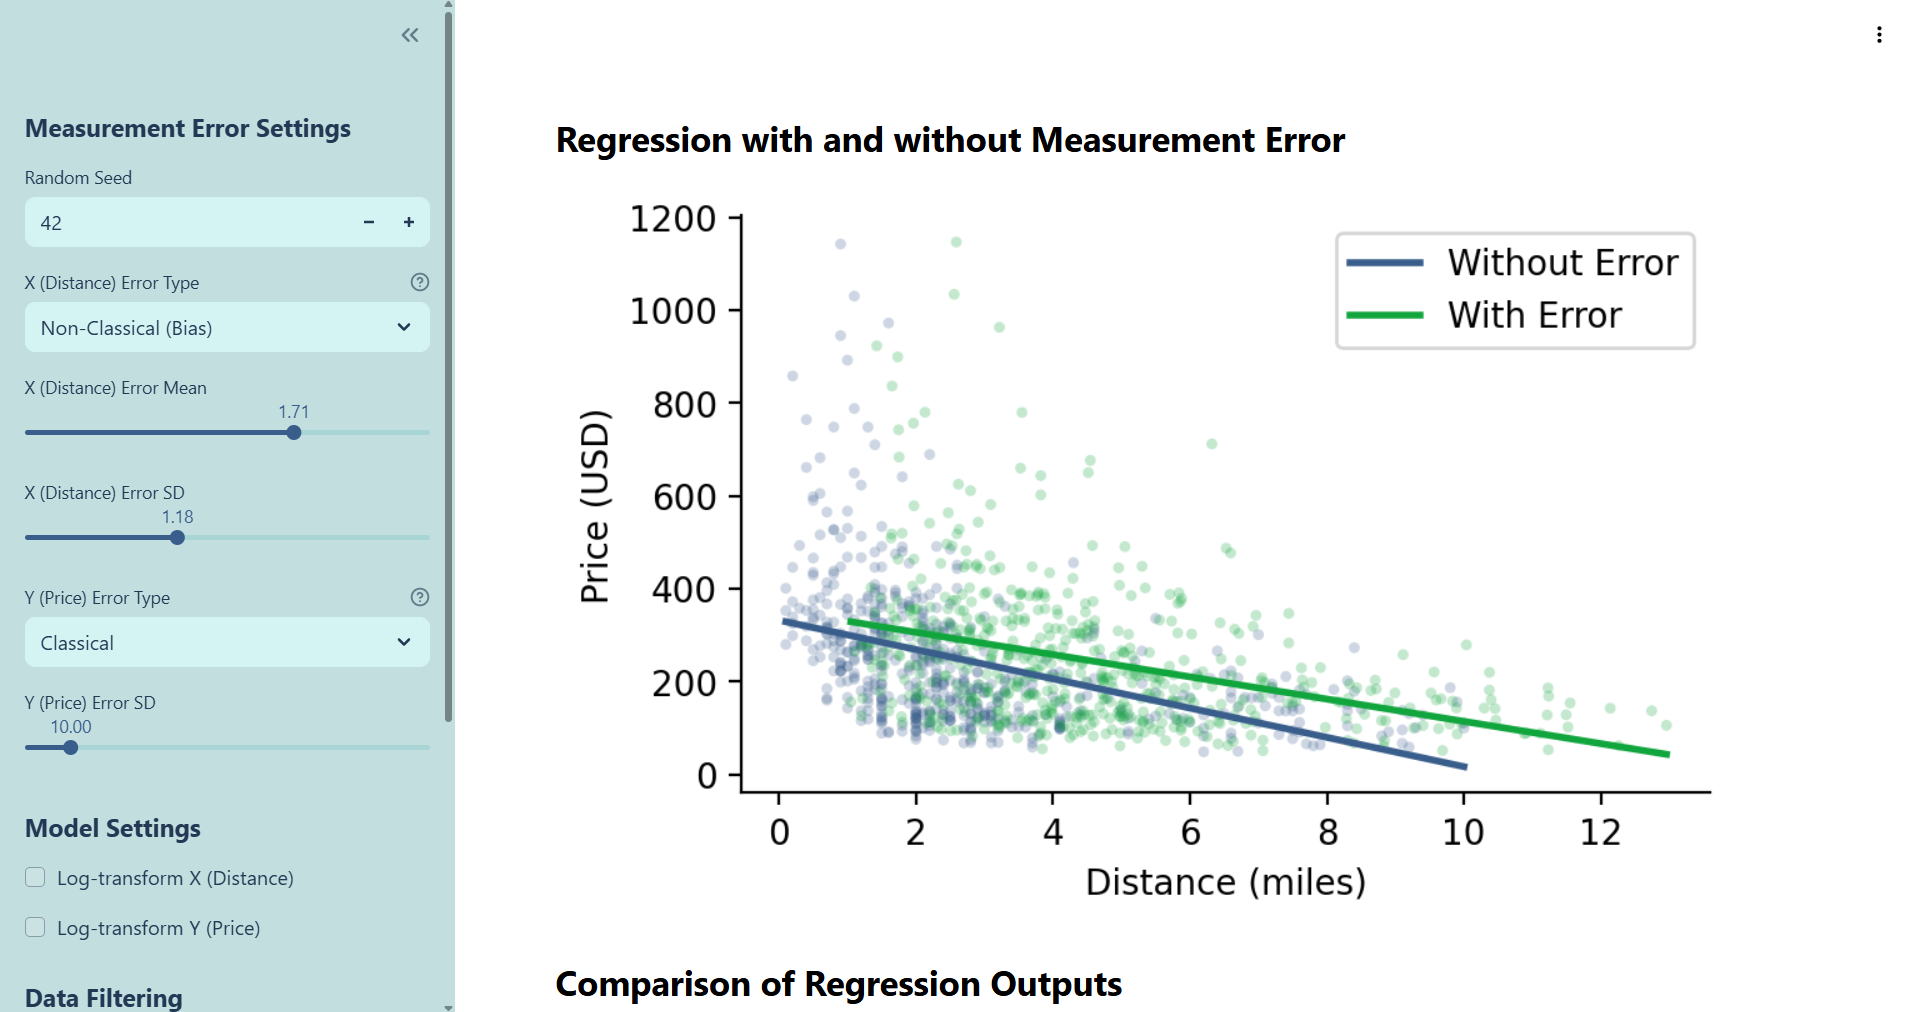
The Hidden Impact of Measurement Error on Regression Analysis The Hidden Impact of Measurement Error on Regression Analysis Understand how measurement error - both random and systematic - can distort your data and bias your regression analysis results. Related textbook chapter: 08. |
|
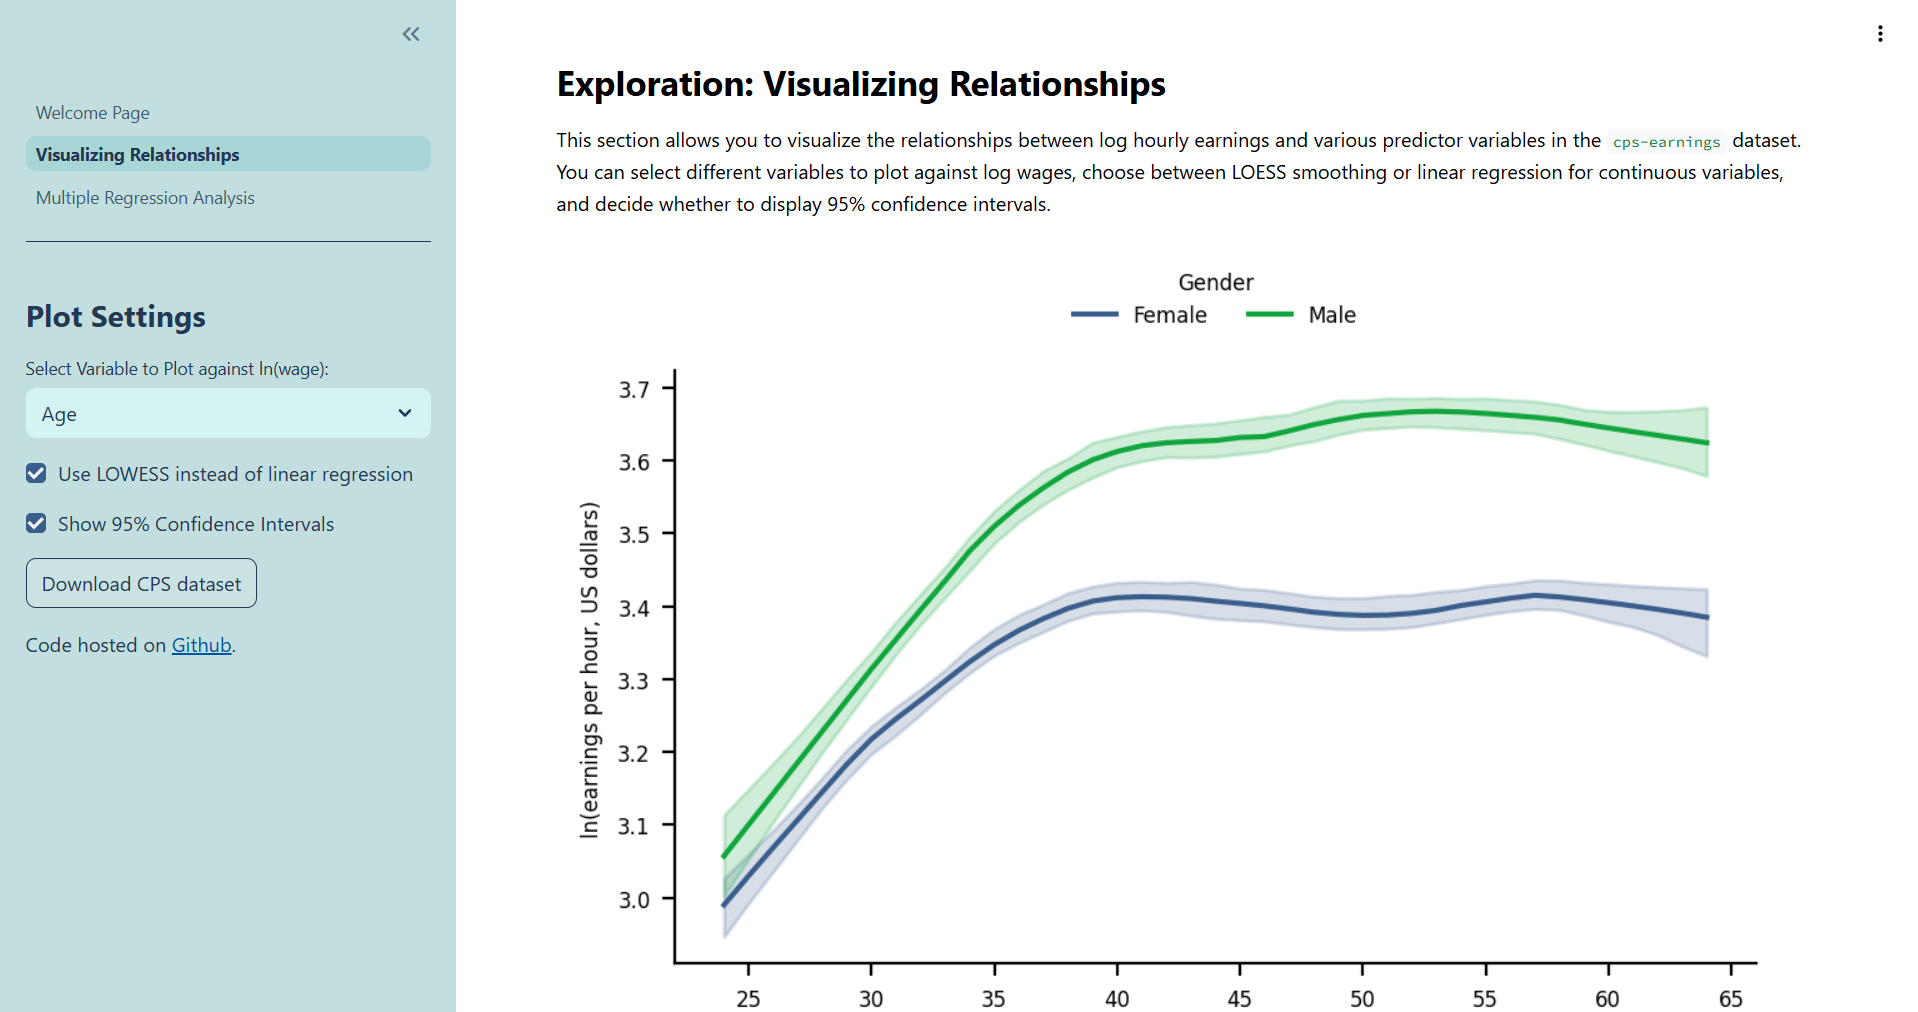
Interactive Multiple Linear Regression Analysis Interactive Multiple Linear Regression Analysis Use the cps-earnings dataset to build and analyze multiple linear regression models. Adjust variables, interpret coefficients, and understand how to control for multiple factors simultaneously to gain richer insights. Related textbook chapter: 10. |
|
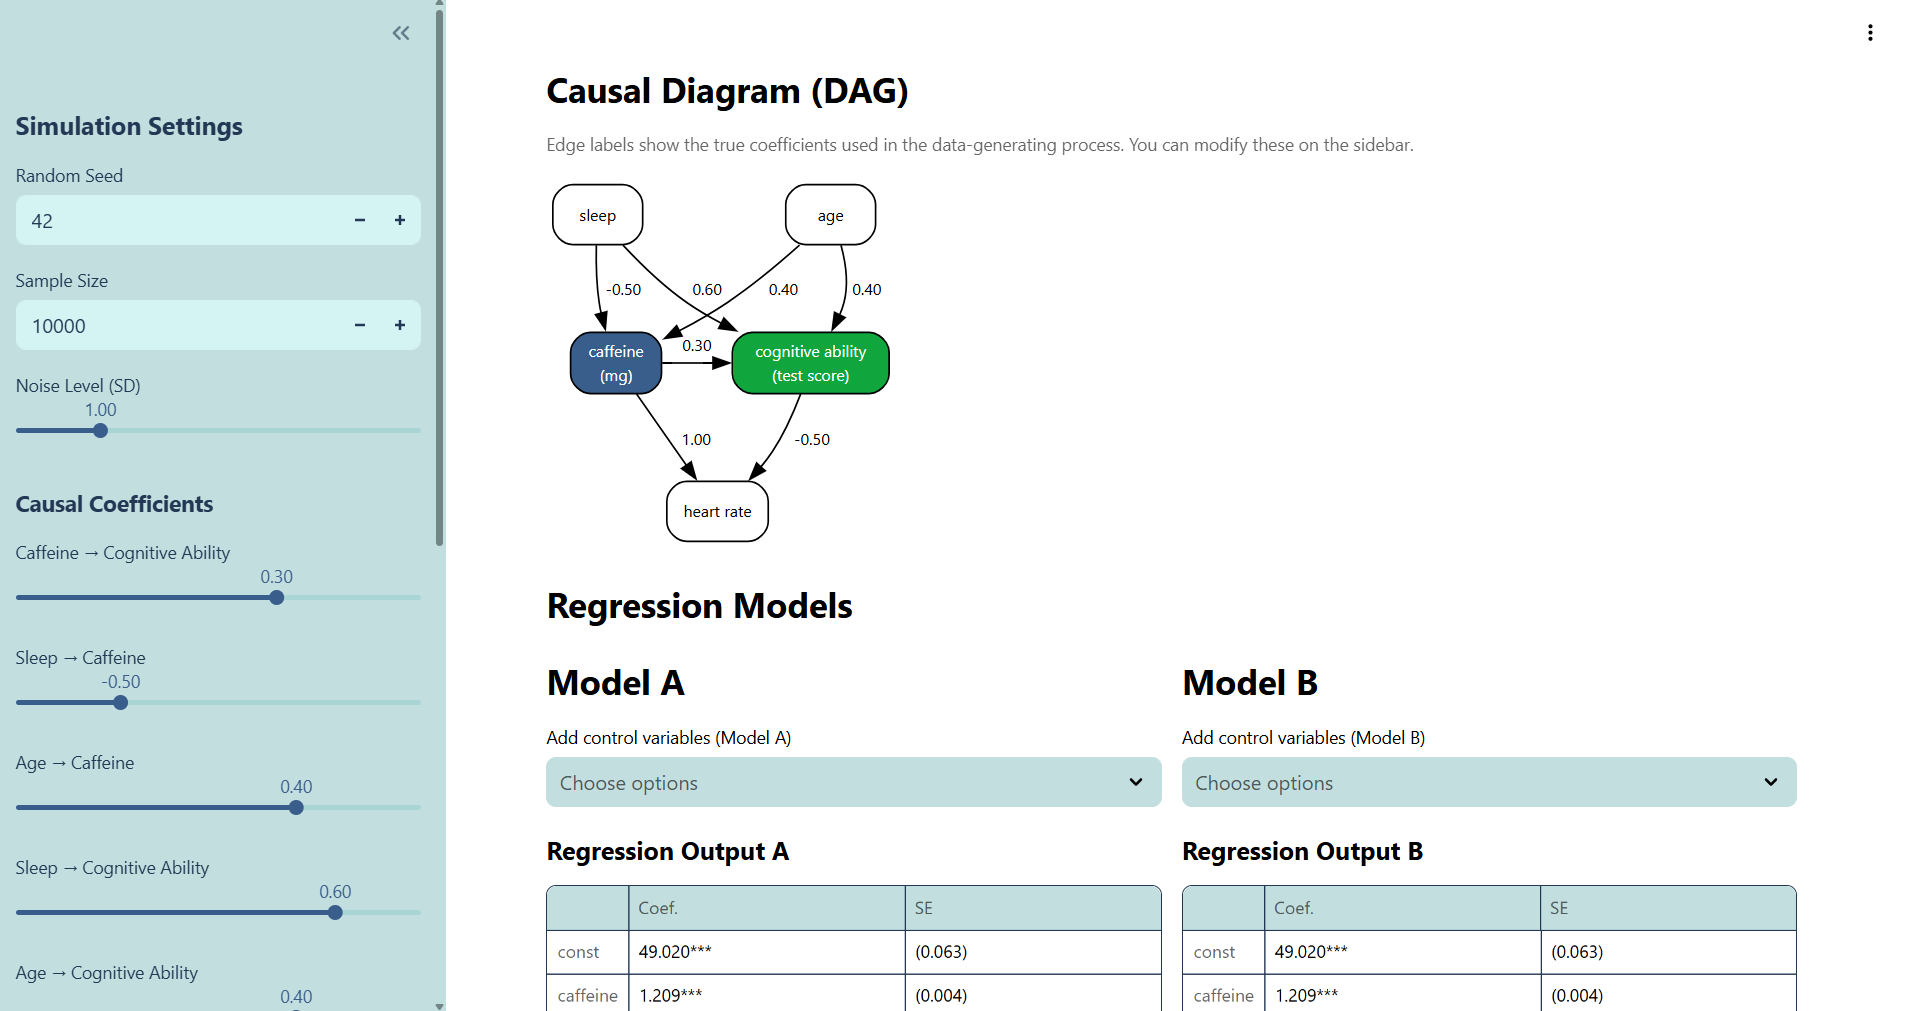
Confounders and Bad Conditioners in Causal Inference Confounders and Bad Conditioners in Causal Inference Explore the complex world of causal inference. Interact with scenarios to see how including or excluding different covariates (confounders and bad conditioners) impacts your final causal estimates. Related textbook chapter: 19. |
|
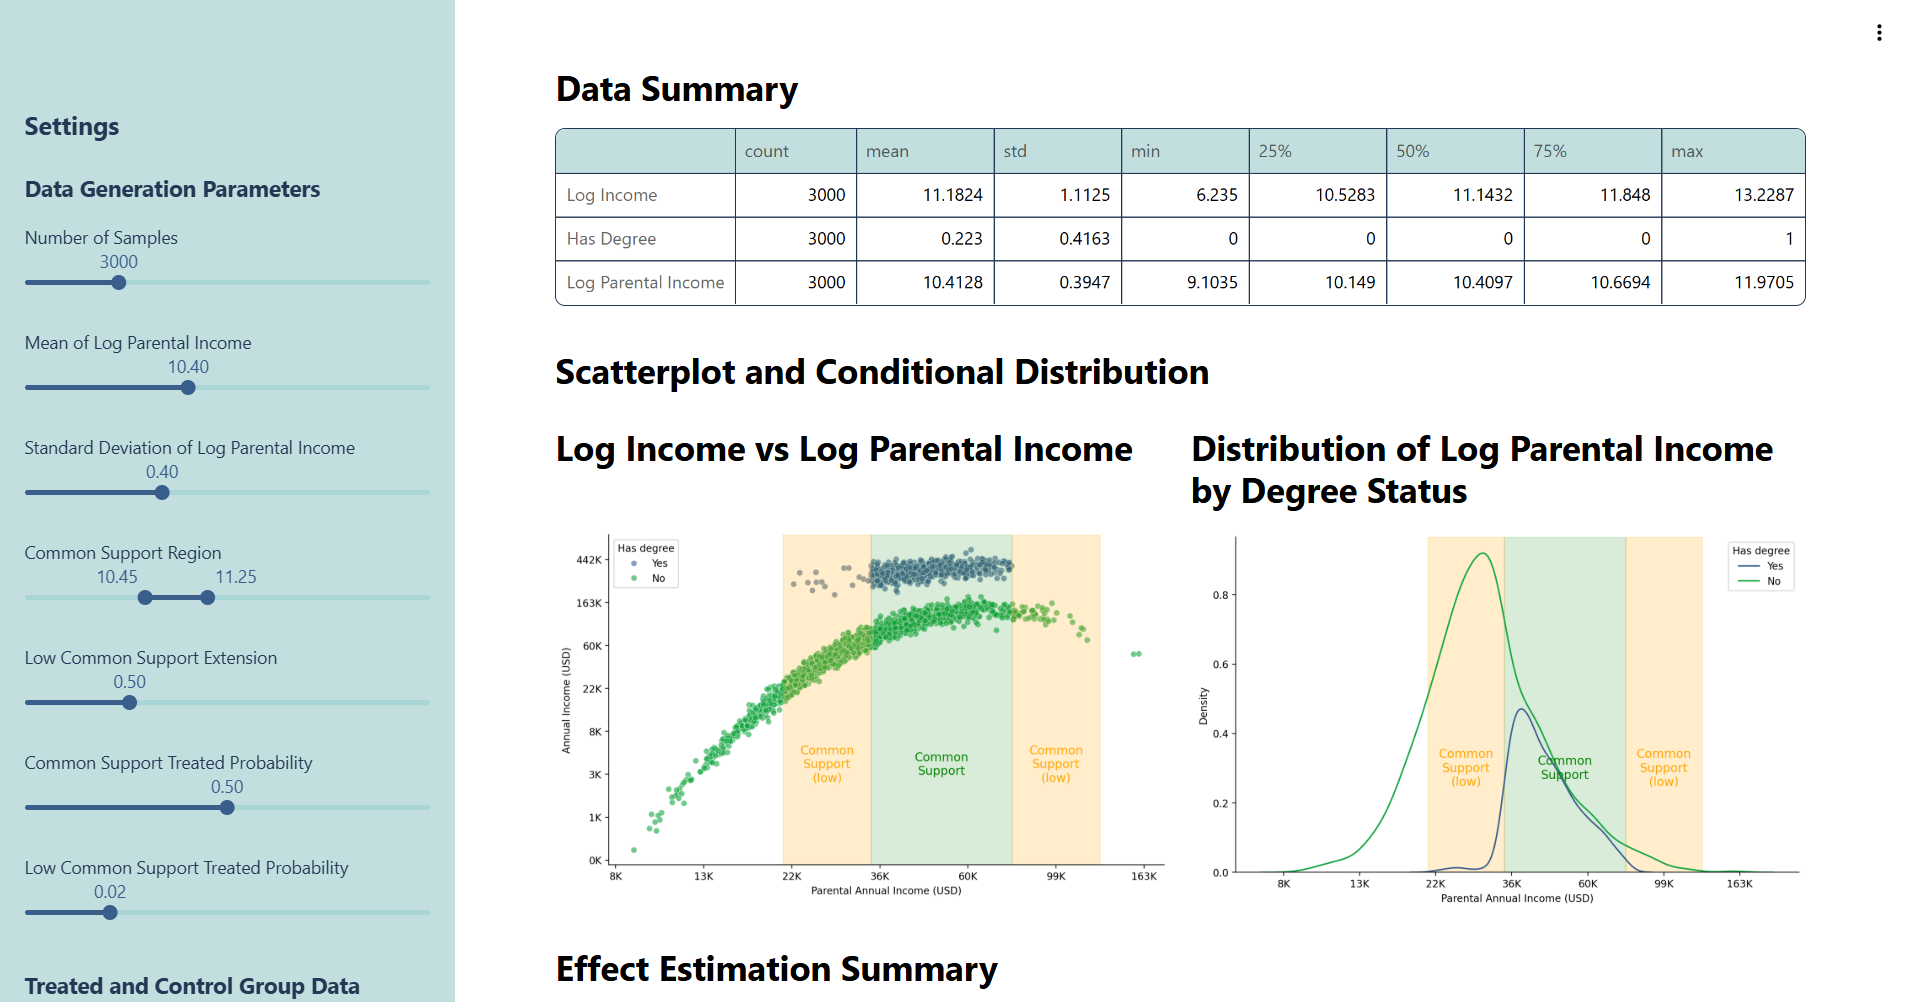
Understanding Common Support in Causal Inference Understanding Common Support in Causal Inference Interactively visualize and explore the importance of common support in your data, and learn why lacking it can undermine your causal claims. Related textbook chapter: 21. |